Normal Distribution (Multi Variable)
Where do you meet this distribution?
- Finance, Economics : Value at Risk
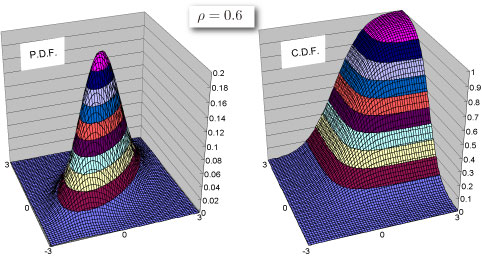
Shape of Distribution
Basic Properties
- For n-variables, means for each variable (n-dimensional vector), standard deviations for each variable (n-dimensional vector ) and correlation coefficients for every pair of variables (n times n matrix. Called correlation matrix) are required (In practice, a covariance matrix calculated from standard deviation vector and correlation correlation matrix is required).
- Continuous distribution defined on
Probability
-
NTBINROMDIST is singular, when correlation coefficient and x1=x2.
-
How to compute these on Excel.
| A | B | |
|---|---|---|
| 1 | Data | Description |
| 2 | 1.5 | Value of 1st. variable for which you want the distribution |
| 3 | -1 | Value of 2nd. variable for which you want the distribution |
| 4 | 1.5 | Mean of variable1 M1 |
| 5 | -1.2 | Mean of variabel2 M2 |
| 6 | 2 | Standard deviation of variable1 Sigma1 |
| 7 | 0.7 | Standard deviation of variabel2 Sigma2 |
| 8 | 0.5 | Correlation coefficient Rho |
| 9 | Formula | Description (Result) |
| 10 | =NTBINORMDIST((A2-A4)/A6,(A3-A5)/A7,A8,TRUE) | Cumulative distribution function for the terms above |
| 11 | =NTBINORMDIST((A2-A4)/A6,(A3-A5)/A7,A8,FALSE) | Probability density function for the terms above |
- Function reference : NTBINORMDIST
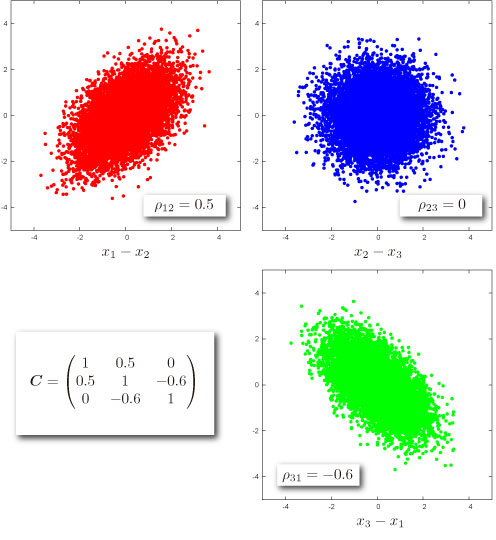
Random Numbers
- How to generate random numbers on Excel.
| A | B | C | D | |
|---|---|---|---|---|
| 1 | Data | Data | Data | Description |
| 2 | 1.44 | 0.48 | -0.36 | cov. matrix |
| 3 | 0.48 | 0.64 | 0 | cov. matrix |
| 4 | -0.36 | 0 | 0.25 | cov. matrix |
| 5 | Data | Data | Data | Description |
| 6 | 1 | 2 | 3 | mean vector |
| 7 | Formula | Description (Result) | ||
| 8 | =NTRANDMULTINORM(100,A2:C4,A6:C6) | 100 normal deviates (x 3 variables) for the terms above |
NtRand Functions
- Generating random numbers based on Mersenne Twister algorithm: NTRANDMULTINORM
- Computing probability for 2-variables : NTBINORMDIST