Truncated Normal Distribution
Where will you meet this distribution?
-
Marketing
"Use of the Left-Truncated Normal Distribution for Improving Achieved Service Levels" by Arvid C. Johnson
-
Agriculte
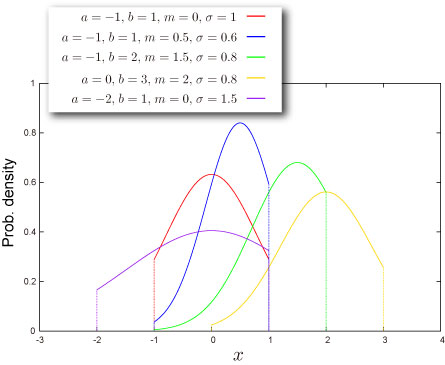
Shape of Distribution
Basic Properties
-
Four parameters are required (How can you get these).
-
Continuous distribution defined on bounded range
-
This distribution can be symmetric or asymmetric.
Probability
-
Cumulative distribution function
where
and is cumulative distribution function of standard normal distribution.
-
How to compute these on Excel.
| A | B | |
|---|---|---|
| 1 | Data | Description |
| 2 | 2.5 | Value for which you want the distribution |
| 3 | 1 | Value of parameter Min |
| 4 | 4 | Value of parameter Max |
| 5 | 3 | Value of parameter M |
| 6 | 0.9 | Value of parameter Sigma |
| 7 | Formula | Description (Result) |
| 8 | =NTTRUNCNORMDIST(A2,A3,A4,A5,A6,TRUE) | Cumulative distribution function for the terms above |
| 9 | =NTTRUNCNORMDIST(A2,A3,A4,A5,A6,FALSE) | Probability density function for the terms above |
- Function reference : NTTRUNCNORMDIST
Quantile
-
Inverse of cumulative distribution function
where
and is cumulative distribution function of standard normal distribution.
-
How to compute this on Excel.
| A | B | |
|---|---|---|
| 1 | Data | Description |
| 2 | 0.5 | Probability associated with the truncated normal distribution |
| 3 | 1 | Value of parameter Min |
| 4 | 4 | Value of parameter Max |
| 5 | 3 | Value of parameter M |
| 6 | 0.9 | Value of parameter Sigma |
| 7 | Formula | Description (Result) |
| 8 | =NTTRUNCNORMINV(A2,A3,A4,A5,A6) | Inverse of the cumulative distribution function for the terms above |
- Function reference : NTTRUNCNORMINV
Characteristics
Mean -- Where is the "center" of the distribution? (Definition)
-
Mean of the distribution is given as
where
, and are probability density function and cumulative distribution function of standard normal distribution respectively.
-
How to compute this on Excel
| A | B | |
|---|---|---|
| 1 | Data | Description |
| 2 | 1 | Value of parameter Min |
| 3 | 4 | Value of parameter Max |
| 4 | 3 | Value of parameter M |
| 5 | 0.9 | Value of parameter Sigma |
| 6 | Formula | Description (Result) |
| 7 | =NTTRUNCNORMMEAN(A2,A3,A4,A5) | Mean of the distribution for the terms above |
- Function reference : NTTRUNCNORMMEAN
Standard Deviation -- How wide does the distribution spread? (Definition)
-
Variance of the distribution is given as
where
, and are probability density function and cumulative distribution function of standard normal distribution respectively.
Standard Deviation is a positive square root of Variance.
-
How to compute this on Excel
| A | B | |
|---|---|---|
| 1 | Data | Description |
| 2 | 1 | Value of parameter Min |
| 3 | 4 | Value of parameter Max |
| 4 | 3 | Value of parameter M |
| 5 | 0.9 | Value of parameter Sigma |
| 6 | Formula | Description (Result) |
| 7 | =NTTRUNCNORMSTDEV(A2,A3,A4,A5) | Standard deviation of the distribution for the terms above |
- Function reference : NTTRUNCNORMSTDEV
Skewness -- Which side is the distribution distorted into? (Definition)
-
Skewness of the distribution is given as
where
, and are probability density function and cumulative distribution function of standard normal distribution respectively.
-
How to compute this on Excel
| A | B | |
|---|---|---|
| 1 | Data | Description |
| 2 | 1 | Value of parameter Min |
| 3 | 4 | Value of parameter Max |
| 4 | 3 | Value of parameter M |
| 5 | 0.9 | Value of parameter Sigma |
| 6 | Formula | Description (Result) |
| 7 | =NTTRUNCNORMSKEW(A2,A3,A4,A5) | Skewness of the distribution for the terms above |
- Function reference : NTTRUNCNORMSKEW
Kurtosis -- Sharp or Dull, consequently Fat Tail or Thin Tail (Definition)
-
Kurtosis of the distribution is given as
where
, and are probability density function and cumulative distribution function of standard normal distribution respectively.
-
How to compute this on Excel
| A | B | |
|---|---|---|
| 1 | Data | Description |
| 2 | 1 | Value of parameter Min |
| 3 | 4 | Value of parameter Max |
| 4 | 3 | Value of parameter M |
| 5 | 0.9 | Value of parameter Sigma |
| 6 | Formula | Description (Result) |
| 7 | =NTTRUNCNORMKURT(A2,A3,A4,A5) | Kurtosis of the distribution for the terms above |
- Function reference : NTTRUNCNORMKURT
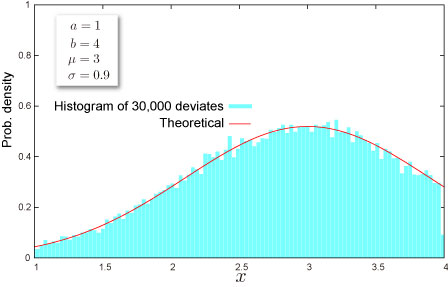
Random Numbers
-
Random number x is generated by inverse function method, which is for uniform random U,
where
, and are probability density function and cumulative distribution function of standard normal distribution respectively.
-
How to generate random numbers on Excel.
| A | B | |
|---|---|---|
| 1 | Data | Description |
| 2 | 1 | Value of parameter Min |
| 3 | 4 | Value of parameter Max |
| 4 | 3 | Value of parameter M |
| 5 | 0.9 | Value of parameter Sigma |
| 6 | Formula | Description (Result) |
| 7 | =NTRANDTRUNCNORM(100,A2,A3,A4,A5,0) | 100 truncated normal deviates based on Mersenne-Twister algorithm for which the parameters above |
Note The formula in the example must be entered as an array formula. After copying the example to a blank worksheet, select the range A7:A106 starting with the formula cell. Press F2, and then press CTRL+SHIFT+ENTER.
NtRand Functions
- If you already have parameters of the distribution
- Generating random numbers based on Mersenne Twister algorithm: NTRANDTRUNCNORM
- Computing probability : NTTRUNCNORMDIST
- Computing quantile : NTTRUNCNORMINV
- Computing mean : NTTRUNCNORMMEAN
- Computing standard deviation : NTTRUNCNORMSTDEV
- Computing skewness : NTTRUNCNORMSKEW
- Computing kurtosis :� NTTRUNCNORMKURT
- Computing moments above at once : NTTRUNCNORMMOM
- If you know mean and standard deviation of the distribution
- Estimating parameters of the distribution:NTTRUNCNORMPARAM